Real Asset Portfolios
The sample is populated by the individual stocks in the following stock market indexes:
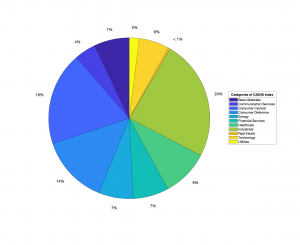
- CAC40 (France): A capitalization-weighted index consisting of the 40 most significant stocks (from a pool of 100 large capitalization stocks) traded on the Euronext Paris, also known as the Paris Bourse.
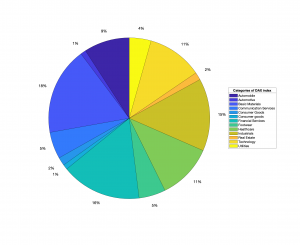
- DAX (Germany): A capitalization-weighted index consisting of 30 selected large capitalization stocks traded on the Frankfurt Stock Exchange.
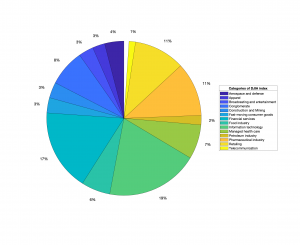
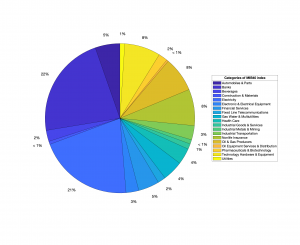
- Dow Jones Industrial Average – DJIA (USA): A price-weighted index of 30 companies from various industries listed on the New York Stock Exchange and the Nasdaq.
- Hang Seng Index – HSI (Hong Kong): A freefloat-adjusted market-capitalization-weighted index tracking the 50 largest companies of the Hong Kong Stock Exchange.
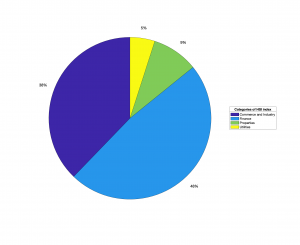
- IBEX35 (Spain): A market capitalization weighted index comprising the 35 most liquid stocks traded in the Bolsa de Madrid.
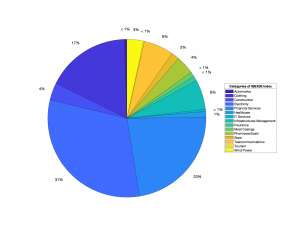
- Milano Indice di Borsa – MIB (Italy): A weighted index consisting of 40 most-traded stocks representing is the sector weights of the BorsaItaliana exchange.
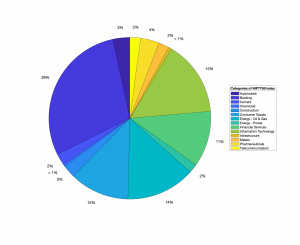
- NIFTY50 (India): A weighted-average index of the 50 largest companies listed on the Indian Stock Exchange.
- Nikkei225 (Japan): A price-weighted index of the 225 large, publicly-owned companies from various sectors traded on the Tokyo Stock Exchange.
- Sources: Yahoo Finance and official website of each index.
- Time period: 7 January 2010 to 30 September 2020
- Frequency: daily closing prices
The international portfolios have been constructed around the distributional, relational and capitalization characteristics of the stocks included in the overall dataset.
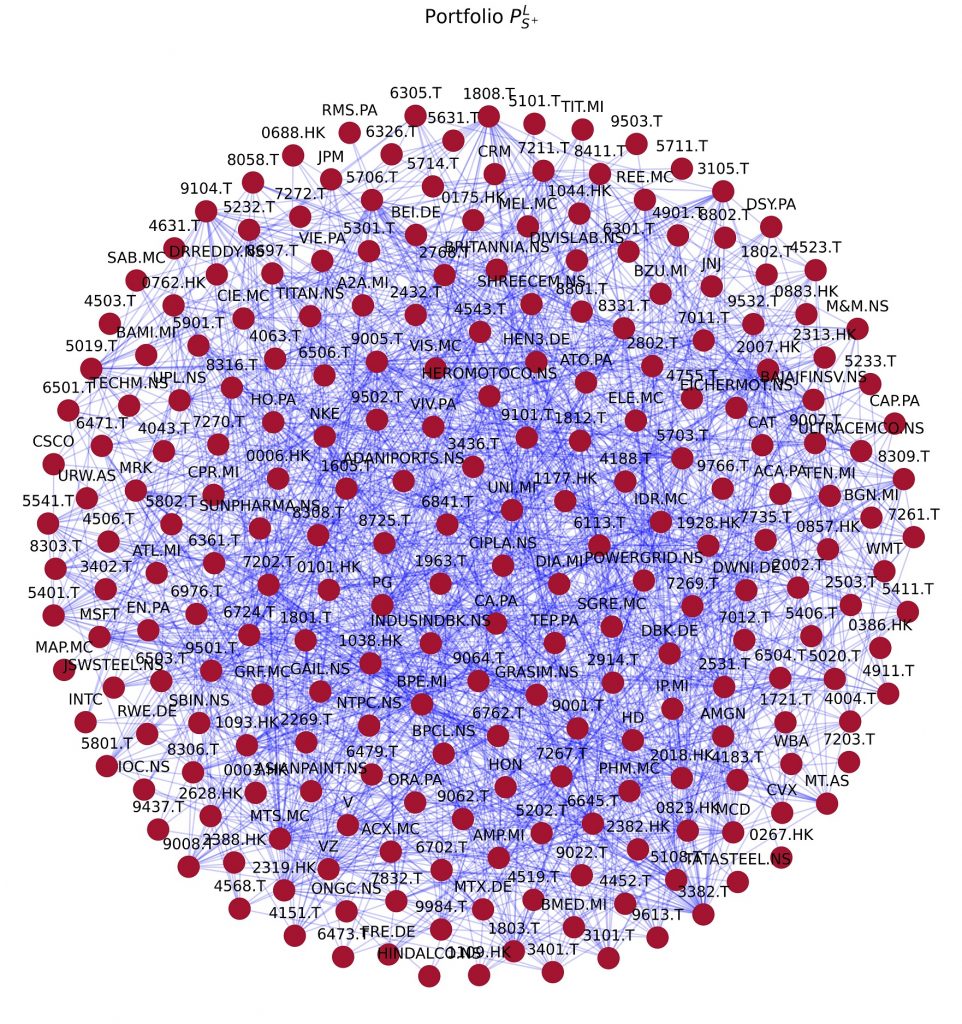
- International portfolio
 selecting among stocks with the highest (top 25%) weighting in each market and positive skewness, and keeps the 10 couples with lowest correlations, as follows:
- Stocks with the highest weighting (highest 25%) in each index.
- Stocks with skewness > 0 and kurtosis > 3.
- 10 couples with the lowest correlation coefficients.
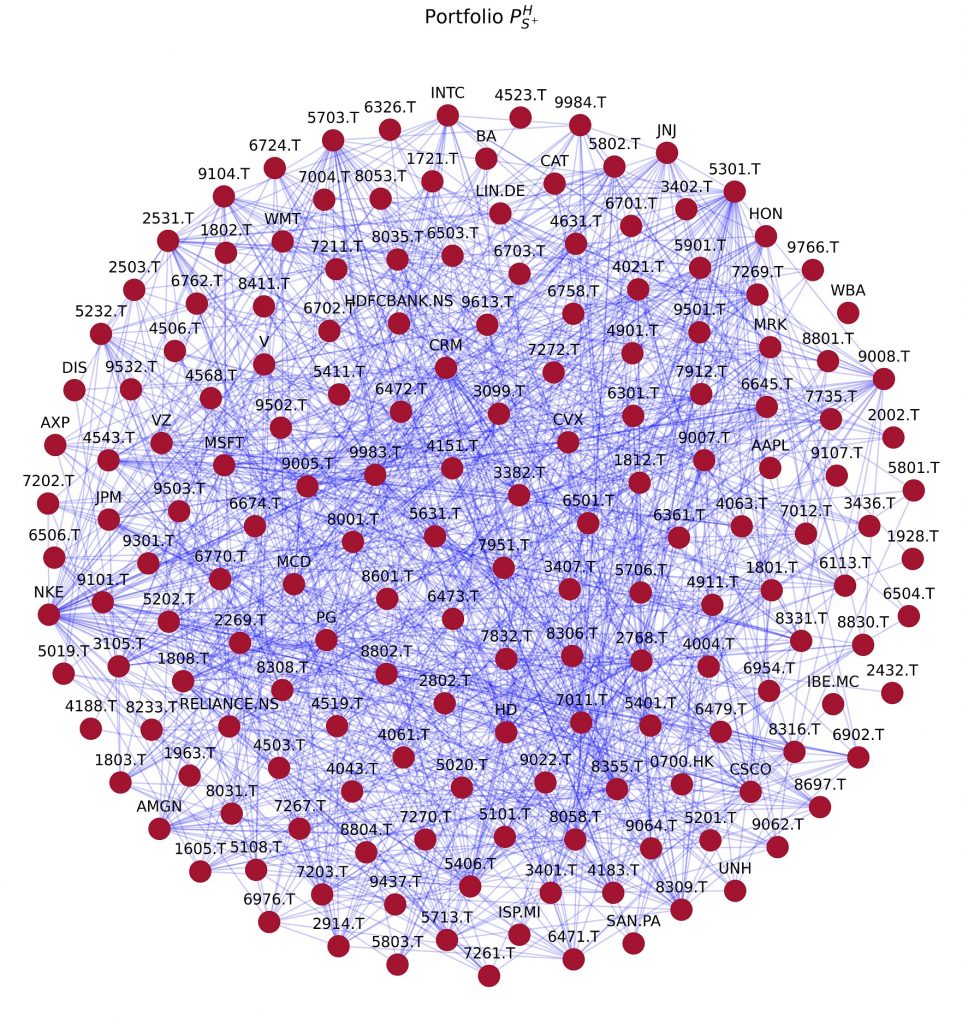
- International portfolio
 is composed of the 10 couples with lowest correlations in which stocks with the lowest (low 25%) weigthing in each market and positive skewness criteria are confirmed, as follows:
- Stocks with the lowest weigthing (low 25%) in each index.
- Stocks with skewness > 0 and kurtosis > 3.
- 10 couples of stocks with the lowest correlation coefficients.
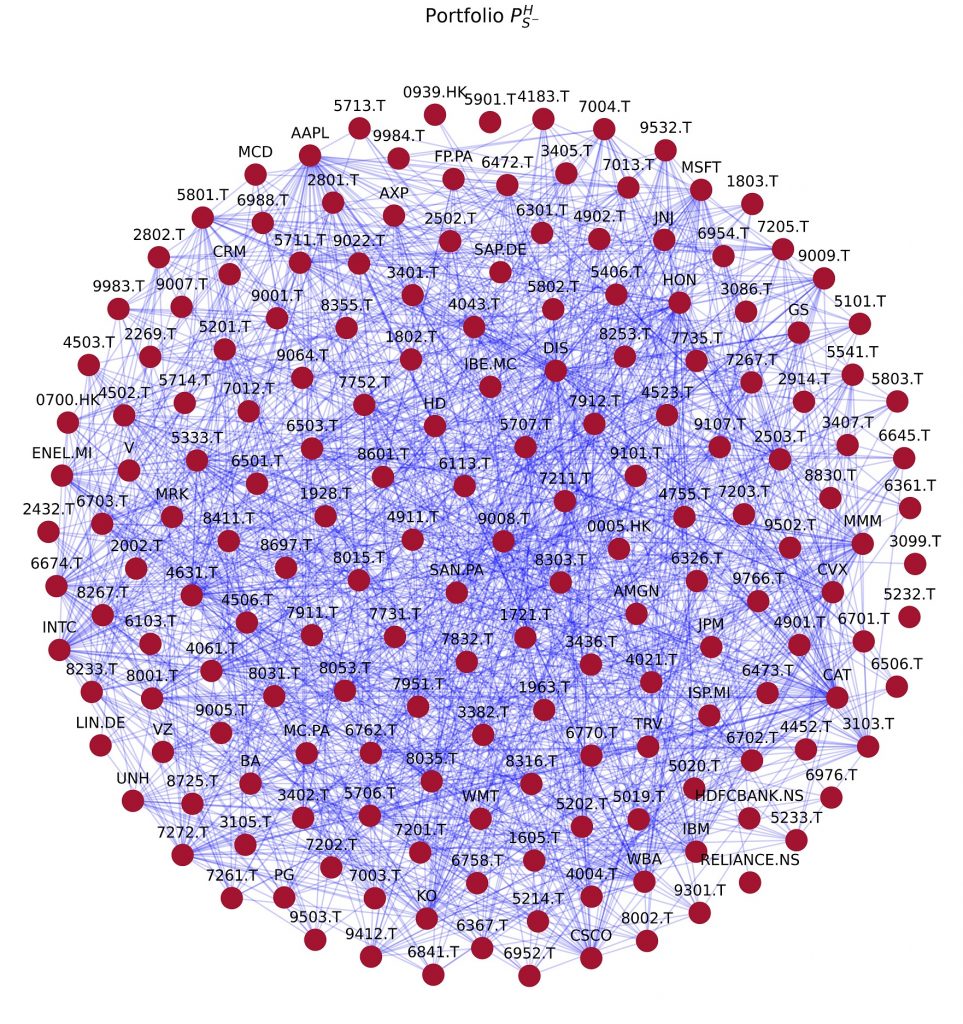
- International portfolio
 including 10 couples with the lowest correlations where the stocks with the highest (top 25%) weigthing in each market, and negative skewness are kept, as follows:
- Stocks with the highest weigthing (top 25%) in each index.
- Stocks with skewness < 0 and kurtosis > 3.
- 10 couples with the lowest correlation coefficients.
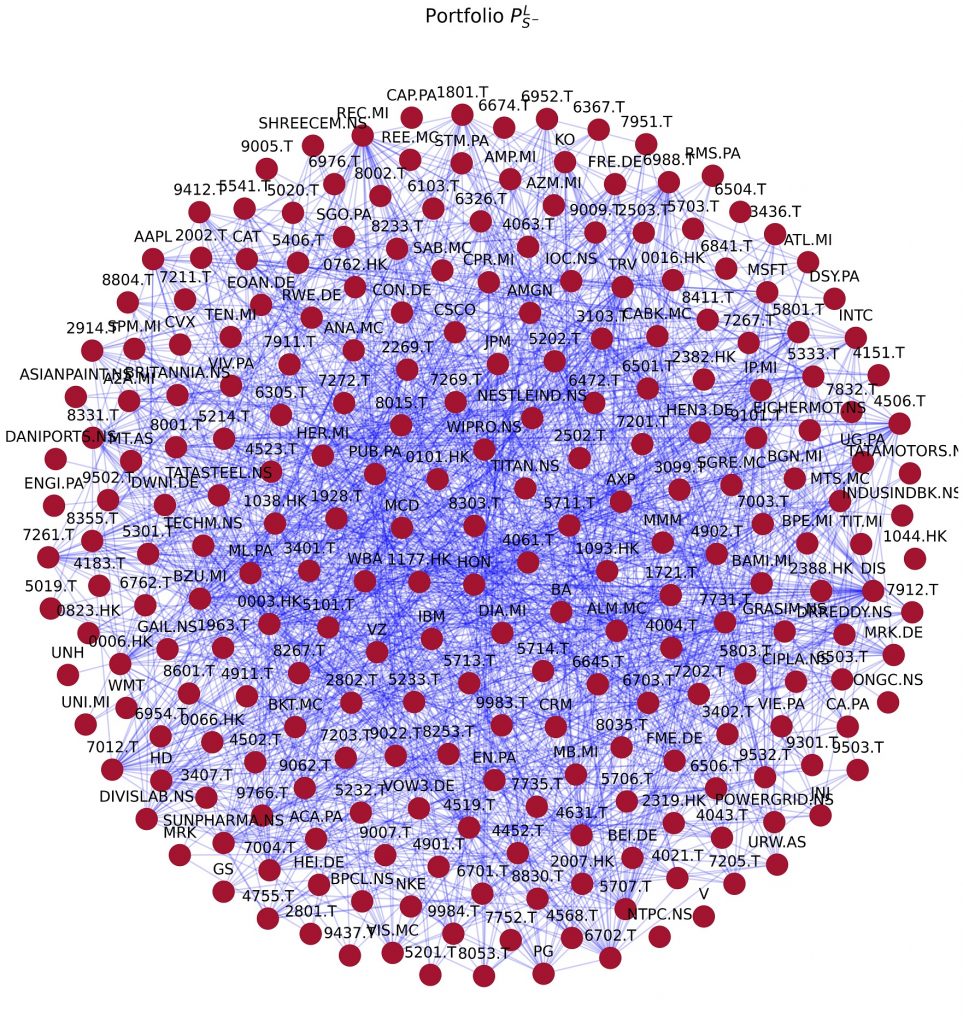
- International portfolio
 having stocks with the lowest (25%) weigthing in each market and negative skewness, and keep 10 couples with the lowest correlations.
- Stocks with the lowest weigthing (lowest 25%) in each index.
- Stocks with skewness < 0 and kurtosis > 3.
- 10 couples with the lowest correlation coefficients.
Overlapping windows analysis with 2000 observations window size and 100 observations step.
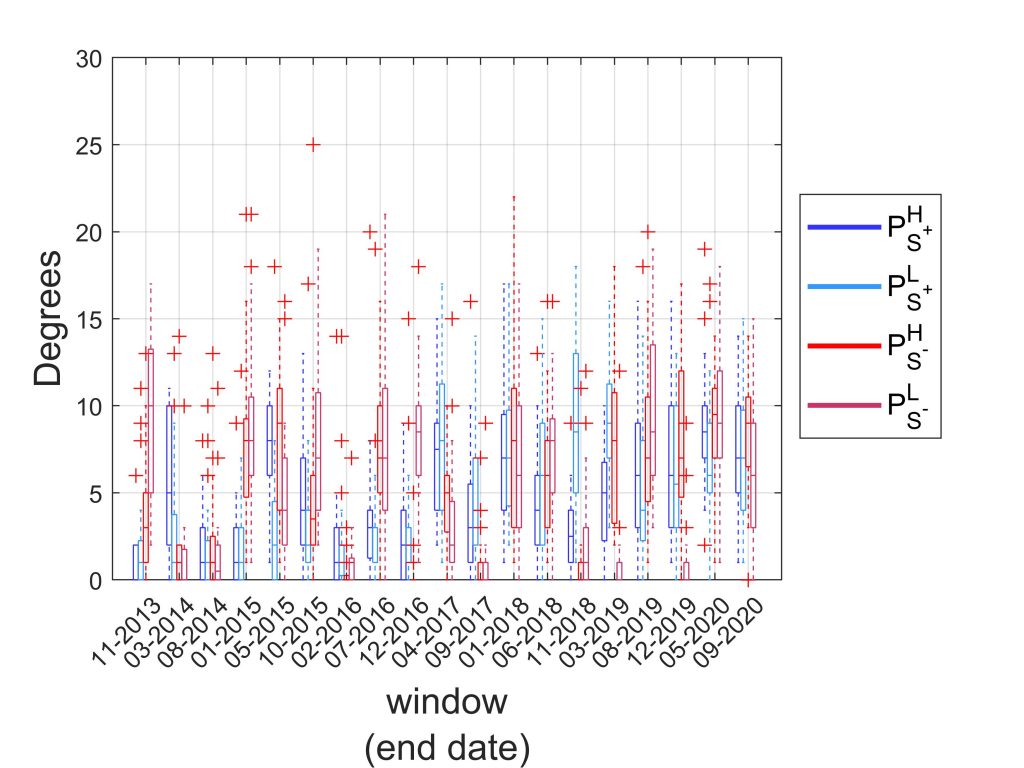
Degrees: the number of connections (links)that a node forms with other nodes. It is generally considered that a node with high degree is a quite significant one for the network, yet there are other characteristics that should be taken into account to evaluate the systemic importance of a node.
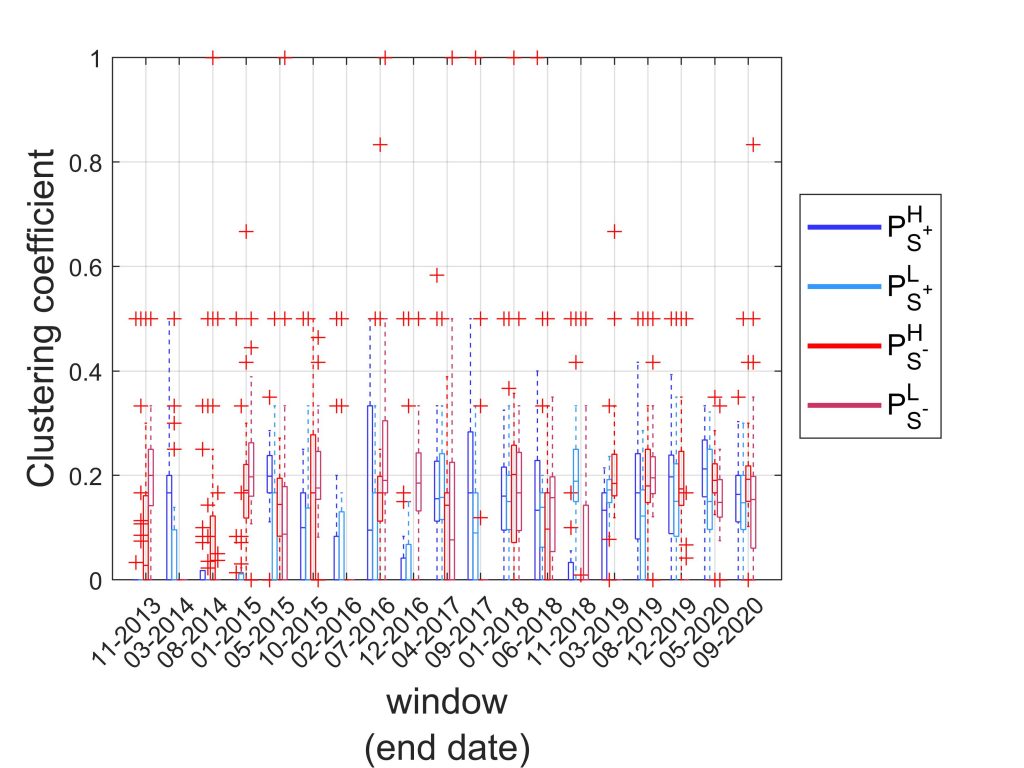
Clustering coefficient: the tendency of nodes to form clusters. A value of clustering coefficient close to 0 indicates that the neighbors of a node are not connected to each other, while on the contrary, values close to 1 show that most of the neighbors are also connected to each other.
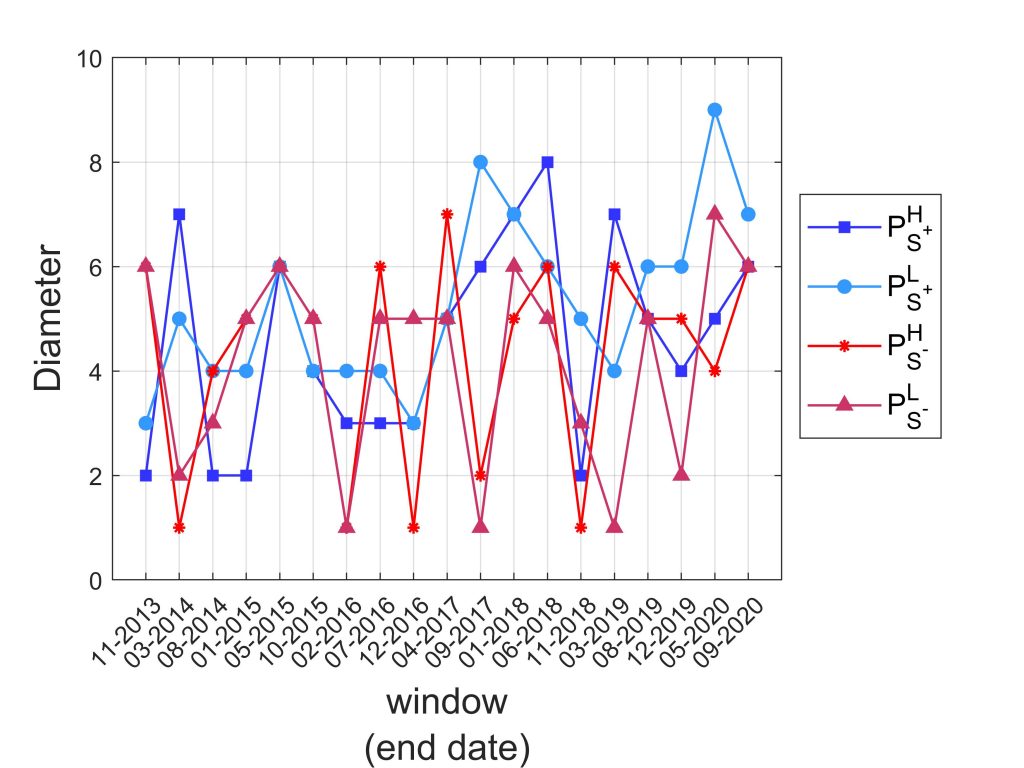
Diameter: The distance that is required to connect the most distant nodes within a network, for all subsamples. Small values of diameter indicate that the nodes are all close to each other and that few steps are required for information to be transferred within the network.
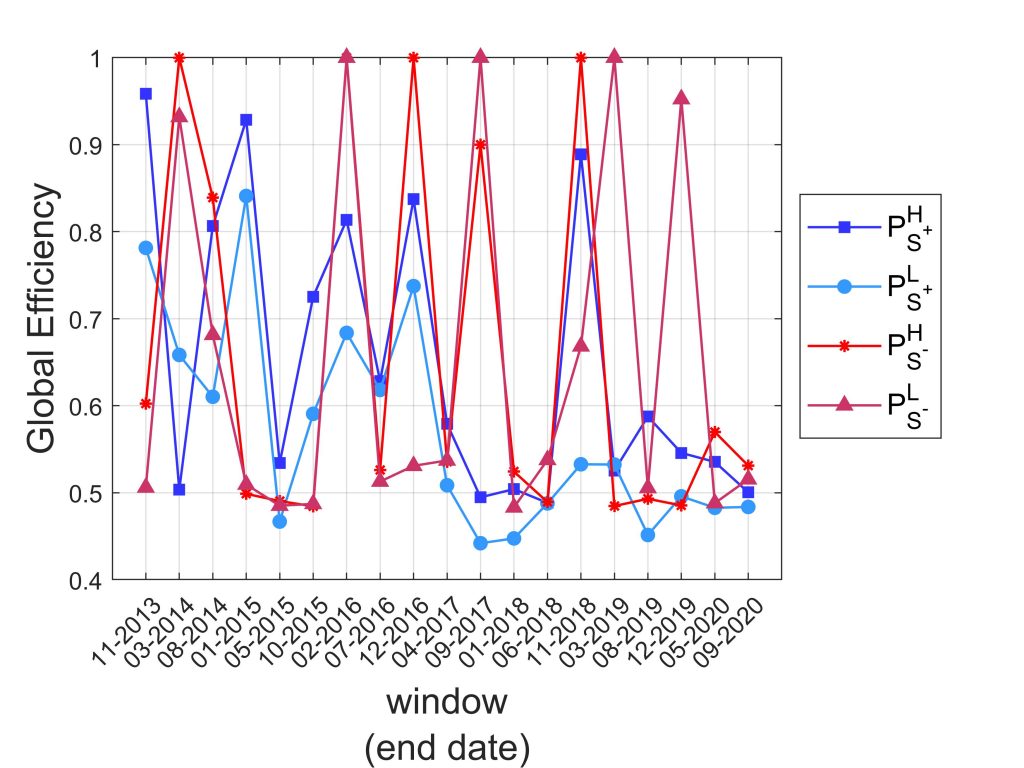
Global efficiency: a measure that evaluates the ability of information spreading within a network.
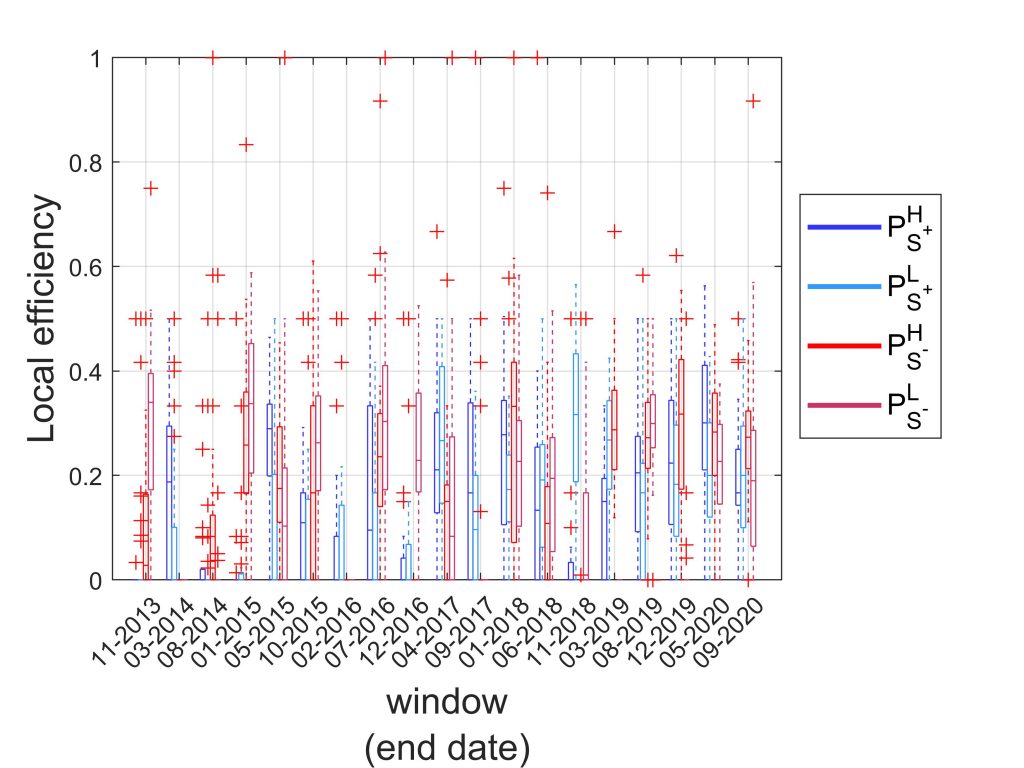
Local efficiency: evaluates the ability of information spreading within the direct neighborhood for a node.
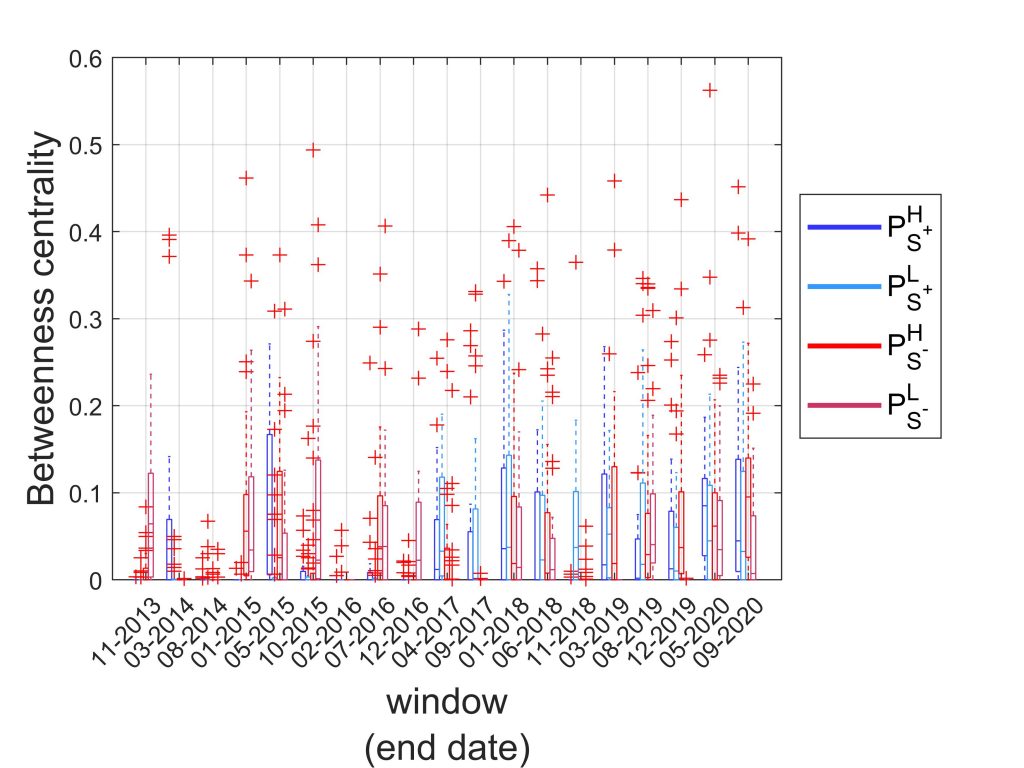
Betweenness centrality:examines whether a node plays the role of a bridge in order to connect other nodes. A high betweenness centrality of a node would indicate that its role is an influential one within the network, as it is important for the immediate information dissemination.
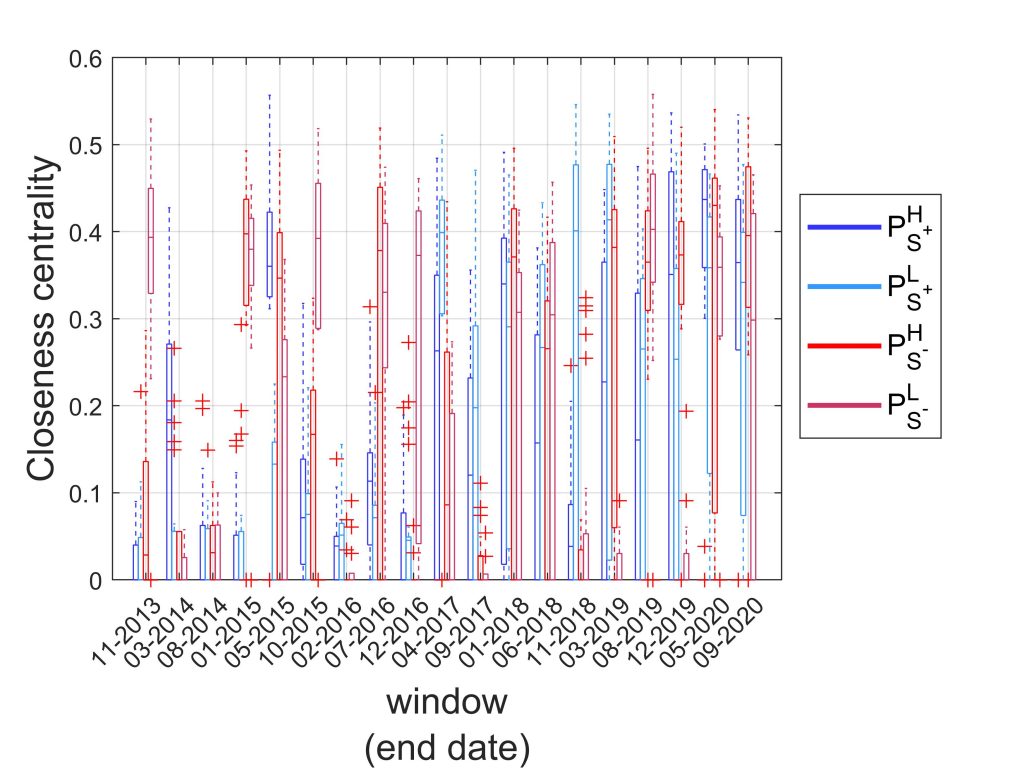
Closeness centrality: A node’s closeness centrality is the reciprocal of the characteristic path length that is the average number of steps required to connect any two pair of nodes and indicates how efficiently information is disseminated among the network nodes. Thus, a short characteristic path length shows that few steps are required to reach a node.
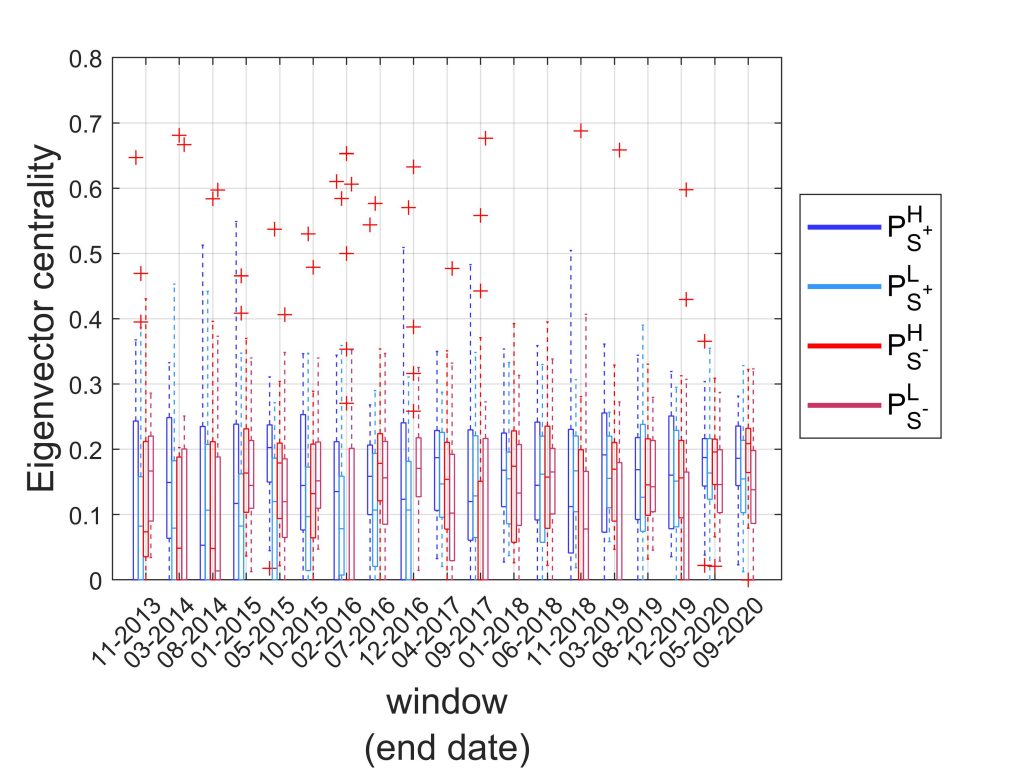
Eigenvector centrality: measures the influence of a node in a network and ranks the nodes according to the number of links that their neighbors form.
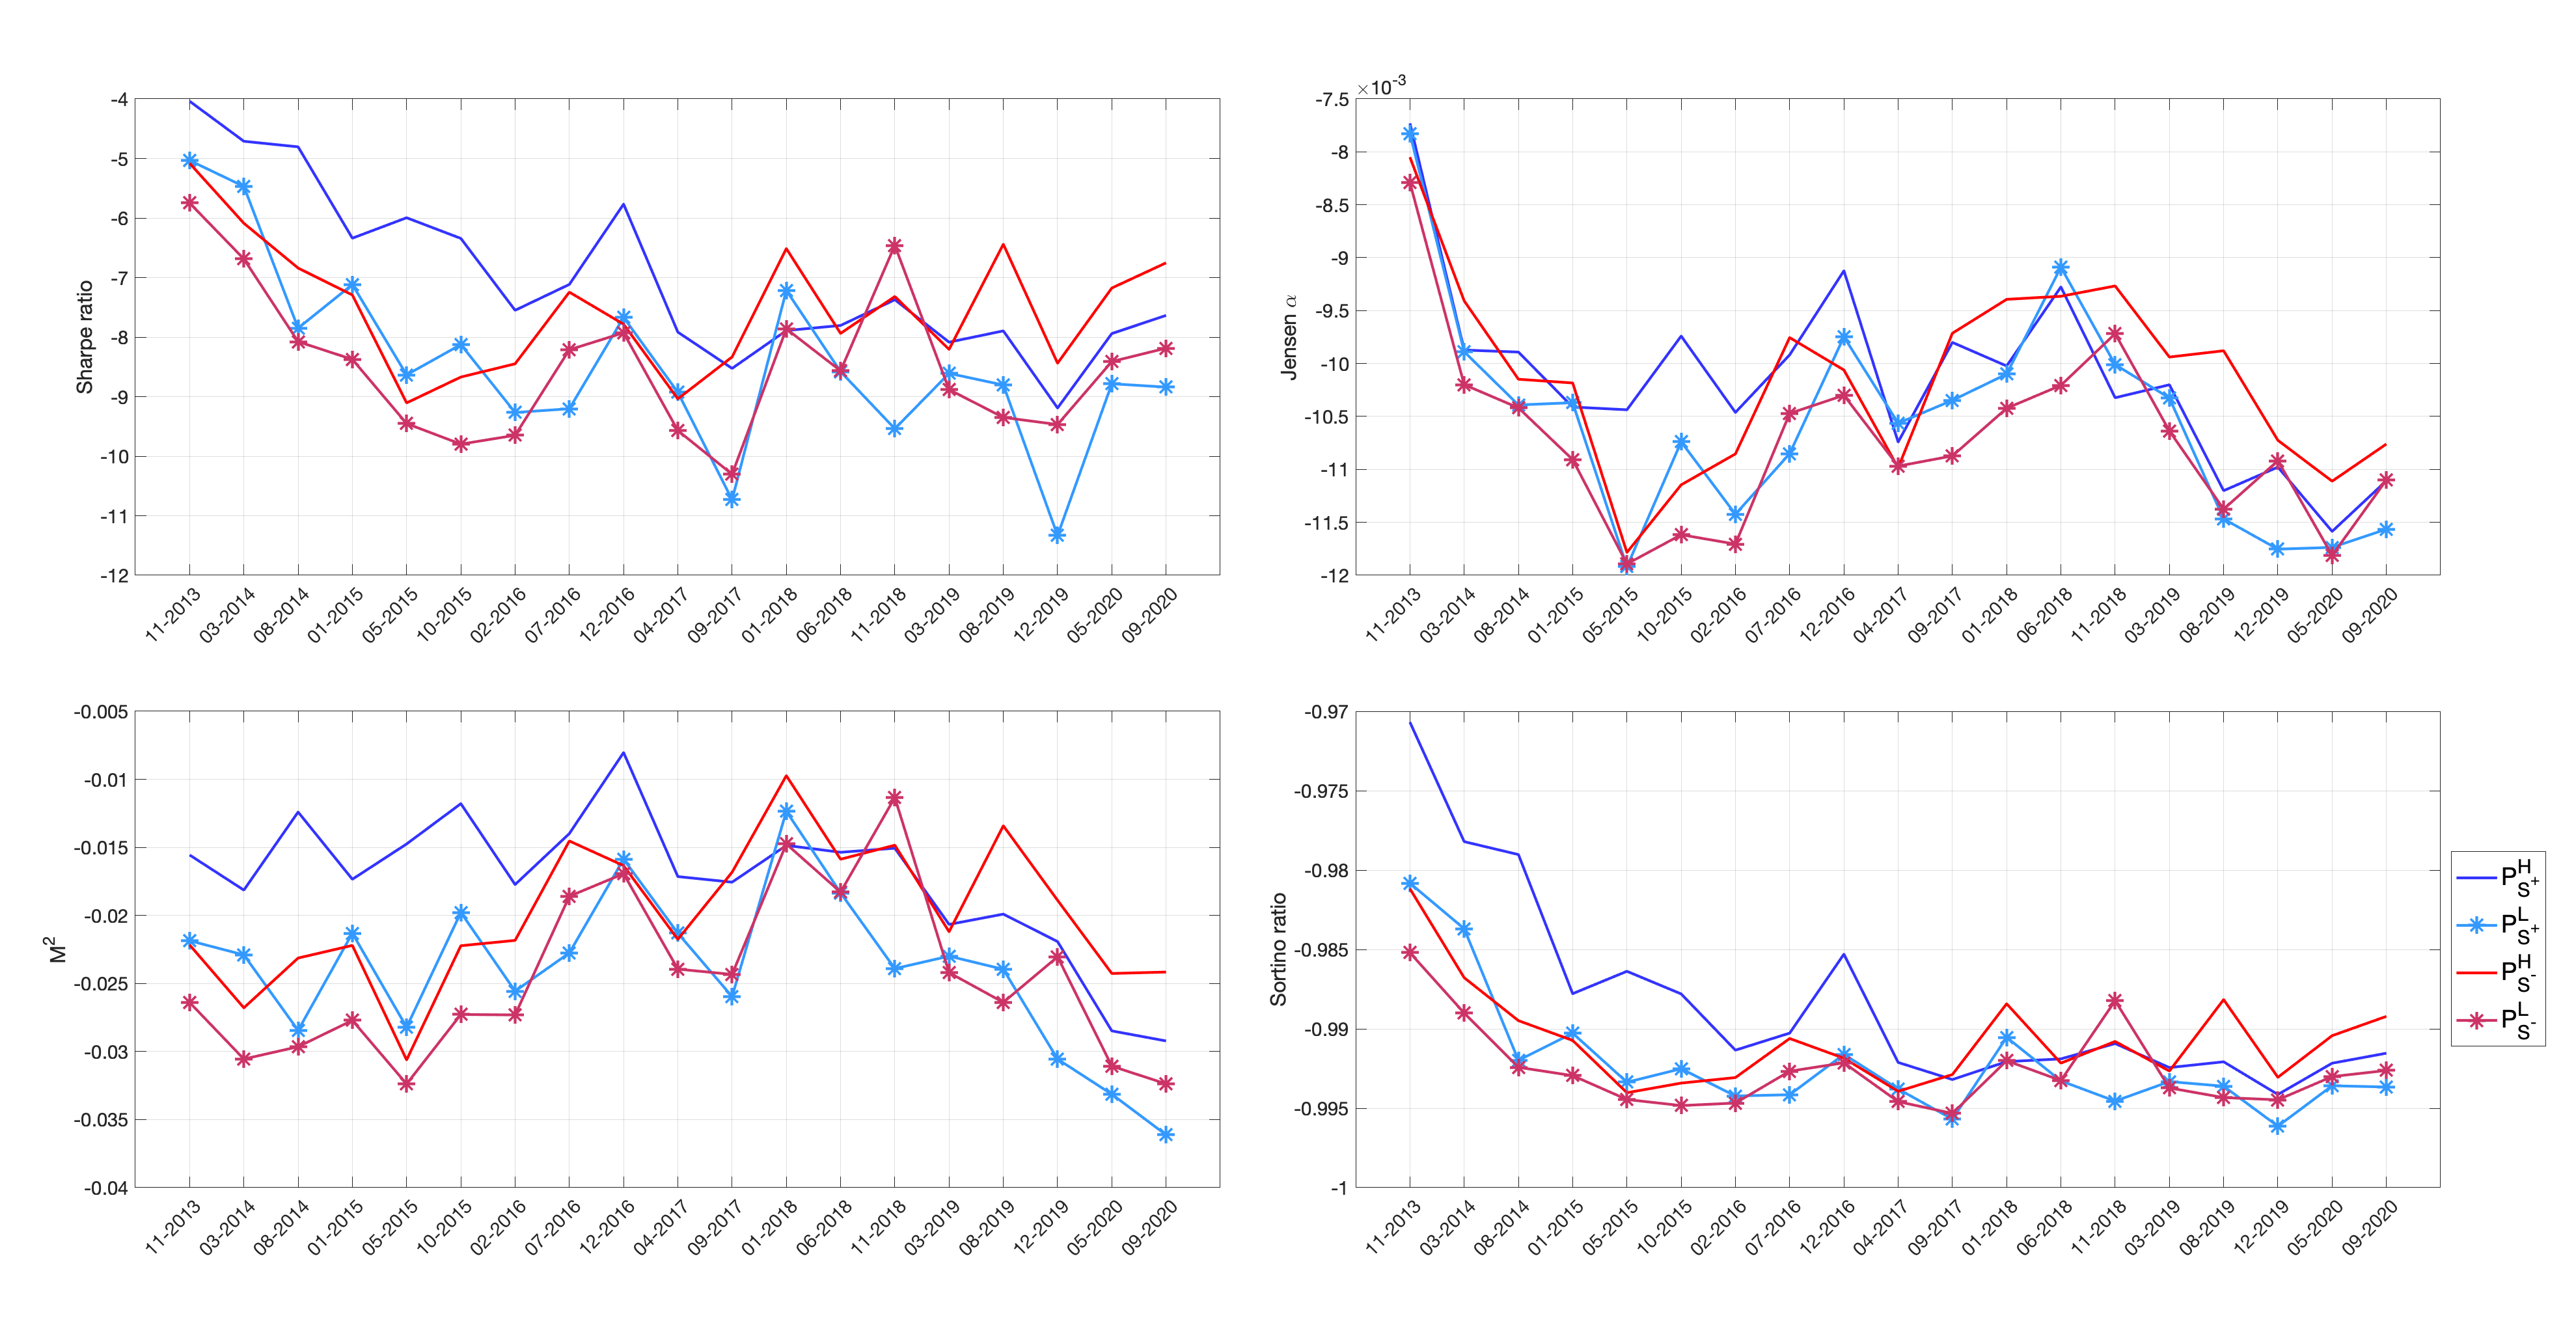
- Until mid-2017, outperforms all portfolios.
- From mid-2017 situation reverses andperforms better, with a short break in the subsample with end-date 11-2018, wheredominates for all measures except for the Jensen’s α.