Results from simulation study
- VAR(1) in 15 variables
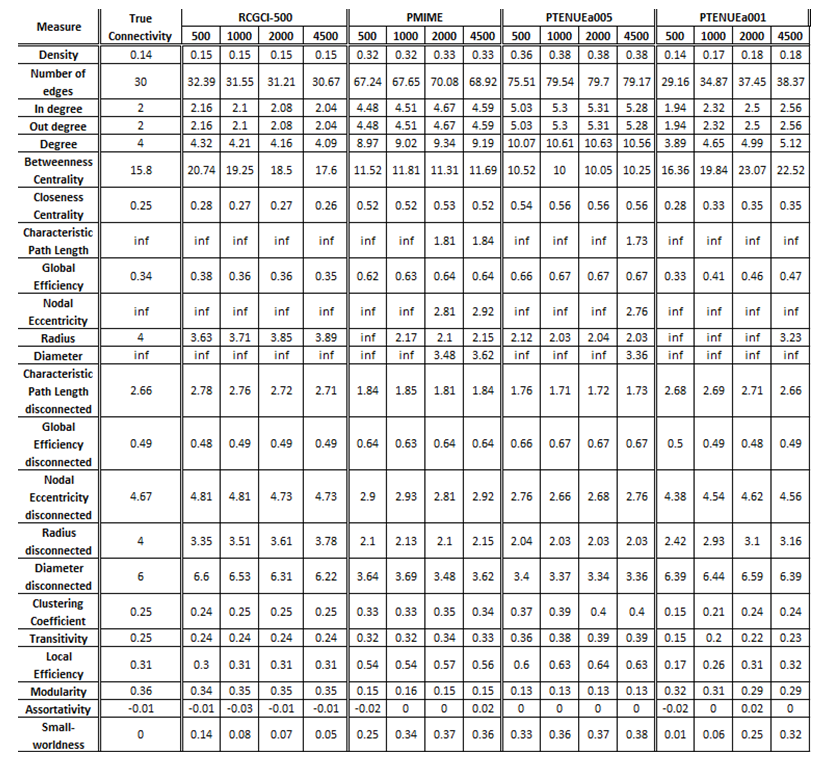
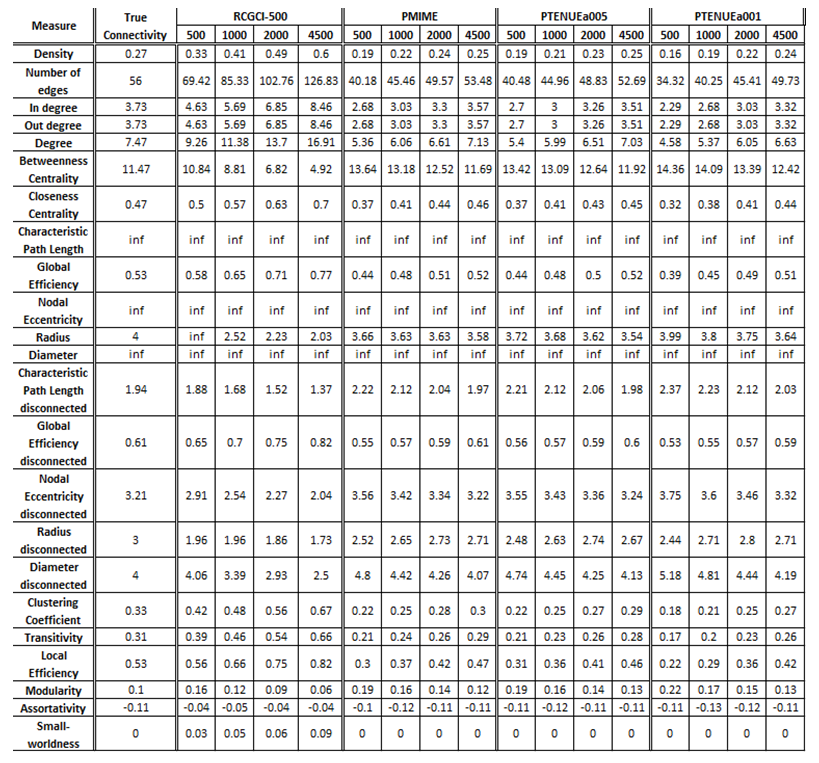
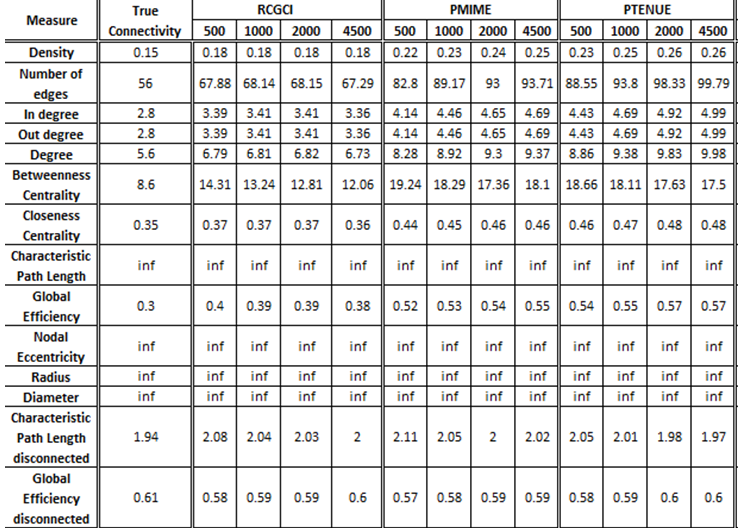
The exported results of network measures based on the true connectivity network and the extracted connectivity networks based on the causality measures RCGCI, PMIME and PTENUE for time series length of 500, 1000, 2000 and 4500.

Networks created using PMIME and PTENUE (a = 0.05) significantly over- or under-estimate network connectivity with the closest value to true connectivity being 12% close and the average difference between them being ~48%. On the other hand, PTENUEa001 results in quite similar results, while RCGCI almost replicates true connectivity for all examined time series lengths.
- VAR(5) in 15 variables
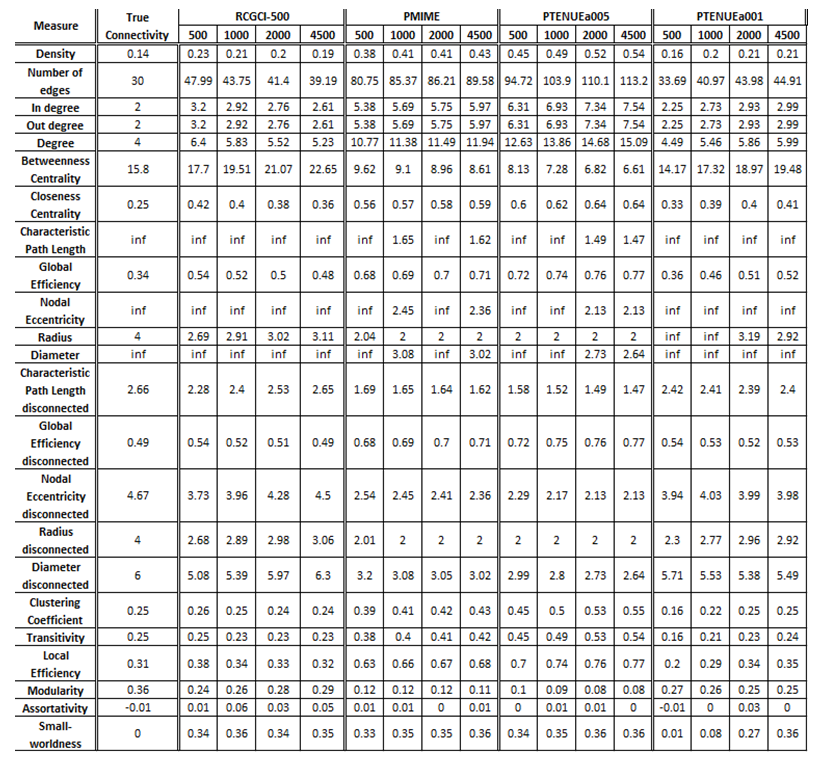
The exported results of network measures based on the true connectivity network and the extracted connectivity networks based on the causality measures RCGCI, PMIME and PTENUE for time series length of 500, 1000, 2000 and 4500.

No causality measure manages to completely replicate the behavior of true connectivity, especially the nonlinear measures PMIME and PTENUE (a = 0.05). The best results are given by PTENUE (a = 0.01), whose results for the shortest sample size (500) are on average as close as 7% to true connectivity (if we exclude assortativity from the average value). For sample size 1000, the average distance from true connectivity becomes 11%. Similar value (12%) is also acquired for RCGCI, for the largest sample size (4500).
- Coupled Henon maps, 15 variables
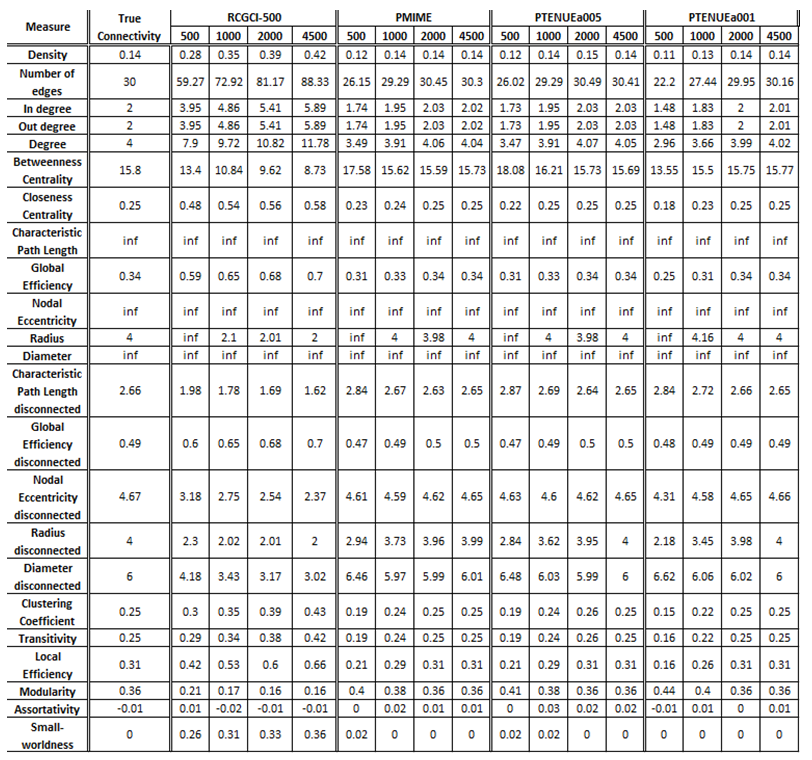
The exported results of network measures based on the true connectivity network and the extracted connectivity networks based on the causality measures RCGCI, PMIME and PTENUE for time series length of 500, 1000, 2000 and 4500.

Networks created using PMIME and PTENUE (significance level a =0.05) are almost the same to the initial, true connectivity networks, while PTENUE (significance level a =0.05) results are also quite acceptable. The best results are acquired when sample sizes are the longest one examined (i.e. 4500). On the other hand, RCGCI results are significantly different for all sample sizes.
- VAR(1) in 15 variables
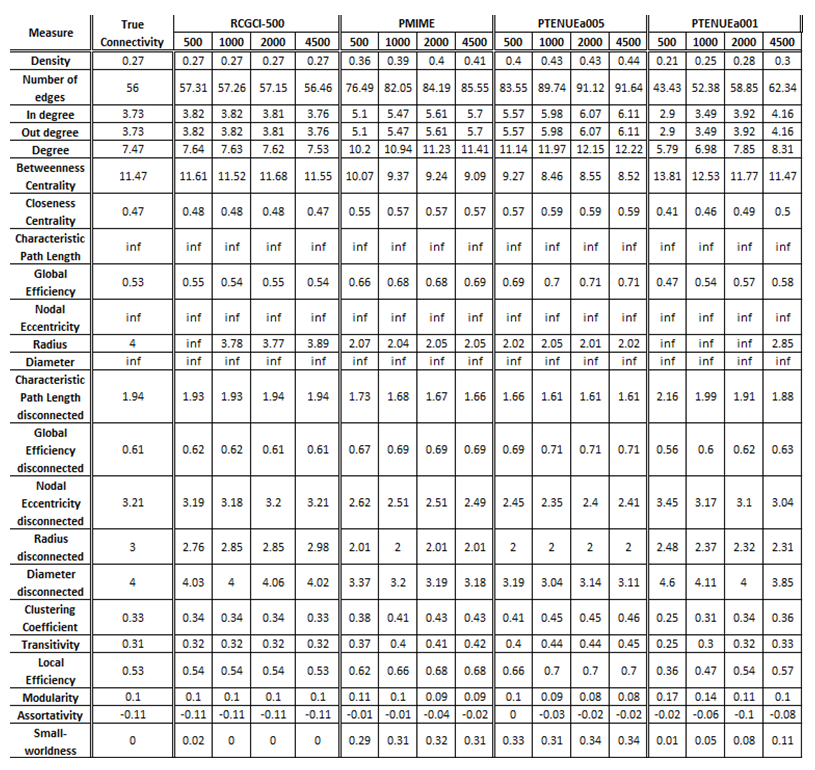
The exported results of network measures based on the true connectivity network and the extracted connectivity networks based on the causality measures RCGCI, PMIME and PTENUE for time series length of 500, 1000, 2000 and 4500.
Networks created using PMIME and PTENUE (a = 0.05) significantly over- or under-estimate network connectivity with the closest value to true connectivity being 25% close and the average difference between them being ~80%. PTENUE (a = 0.01) results are quite better, and it outstands in performance for integration measures. Finally, the best results are acquired by RCGCI, which almost replicates true connectivity, especially for large sample sizes (2000 and 45000), with average differences compared to true connectivity of 4% and 3%, respectively.
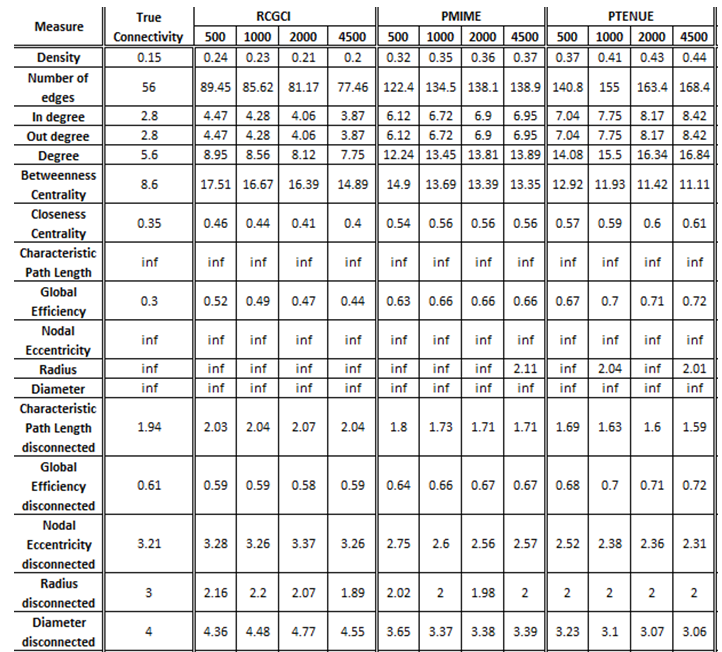
- VAR(5) in 15 variables
The exported results of network measures based on the true connectivity network and the extracted connectivity networks based on the causality measures RCGCI, PMIME and PTENUE for time series length of 500, 1000, 2000 and 4500.
RCGCI for sample size 4500 and PTENUE (a = 0.01) for sample size 500 are the ones that outstand, however, with significant changes compared to true connectivity. To be more specific, the first one differs on average by 18% from true connectivity, with significantly lower differences (better results) for integration measures, while the latter one differs by 15%. The other two measures completely fail to replicate the true connectivity behavior, with all the values being almost twice or half, compared to the expected ones.
- Coupled Henon maps, 15 variables
The exported results of network measures based on the true connectivity network and the extracted connectivity networks based on the causality measures RCGCI, PMIME and PTENUE for time series length of 500, 1000, 2000 and 4500.
Networks created using PMIME, PTENUE (a = 0.05) and PTENUE (a = 0.01) are almost identical to the initial, true connectivity networks, especially for sample sizes greater than 2000, although for smaller ones the results are also acceptable. On the other hand, RCGCI results are significantly different for all sample sizes.
- VAR(1) in 15 variables
The exported results of network measures based on the true connectivity network and the extracted connectivity networks based on the causality measures RCGCI, PMIME and PTENUE for time series length of 500, 1000, 2000 and 4500.
Networks created using PMIME and PTENUE (a = 0.05) significantly over- or under-estimate network connectivity with the closest value to true connectivity being 10% close and the average difference between them being ~30%. On the other hand, PTENUE (a = 0.01) results in quite similar results for sample size 2000 with true connectivity. Finally, the best results are acquired by RCGCI, which almost replicates true connectivity for all examined time series lengths. Even more, for sample size of 4500 the average diversion from true connectivity is less than 1%.
- VAR(5) in 15 variables
he exported results of network measures based on the true connectivity network and the extracted connectivity networks based on the causality measures RCGCI, PMIME and PTENUE for time series length of 500, 1000, 2000 and 4500.

PMIME and PTENUE (a = 0.05) again fail to replicate the behavior of true connectivity, since their results differ on average by 50%. RCGCI for sample size of 4500 gives quite respectable results with the discrepancies from true connectivity being on average 8%. For integration measures, the differences are even smaller. Finally, PTENUE (a = 0.01) for sample size 1000 gives the best results that replicate the true connectivity behavior without over- or under-estimating significantly the measures.
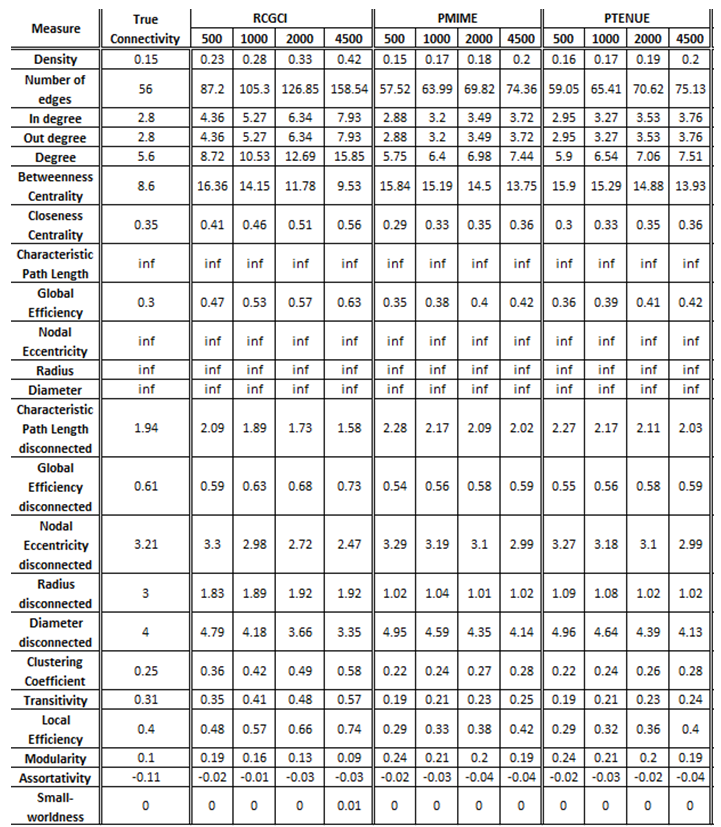
- Coupled Henon maps, 15 variables
The exported results of network measures based on the true connectivity network and the extracted connectivity networks based on the causality measures RCGCI, PMIME and PTENUE for time series length of 500, 1000, 2000 and 4500.
Networks created using PMIME and PTENUE (a = 0.05) are almost the same to the initial, true connectivity networks, while PTENUEa001 results are also quite acceptable. The best results are acquired when sample sizes are the longest one examined (i.e. 4500). On the other hand, RCGCI results are significantly different for all sample sizes.
- VAR(1) in 20 variables
The exported results of network measures based on the true connectivity network and the extracted connectivity networks based on the causality measures RCGCI, PMIME and PTENUE for time series length of 500, 1000, 2000 and 4500.
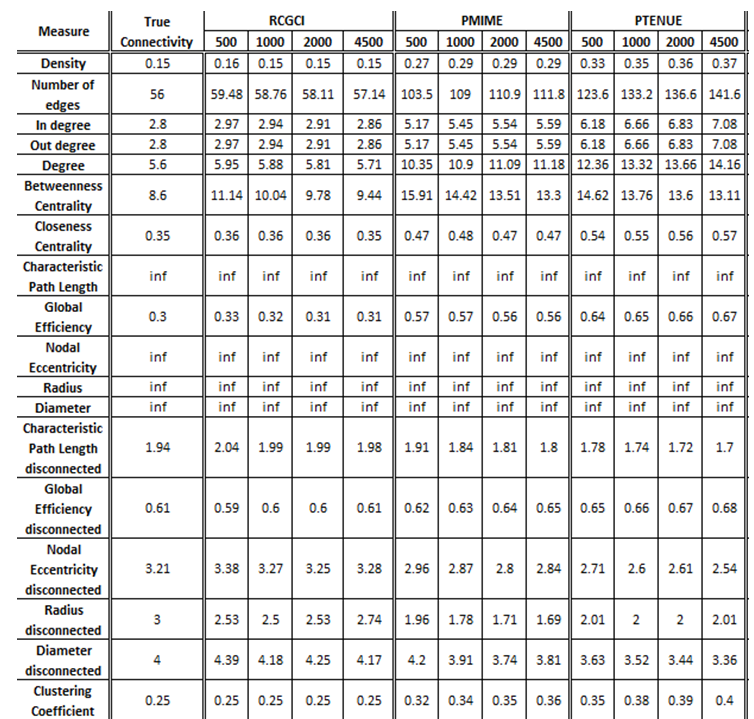

PMIME and PTENUE significantly fail to replicate the behavior of true connectivity, except for the integration measures, transitivity and modularity where they get quite good approximations. One the other hand, RCGCI almost completely replicates true connectivity, for all the measures, especially for the lengthiest timeseries examined, whose values are almost identical to the true ones, with only minor discrepancies.
VAR(5) in 20 variables
The exported results of network measures based on the true connectivity network and the extracted connectivity networks based on the causality measures RCGCI, PMIME and PTENUE for time series length of 500, 1000, 2000 and 4500.
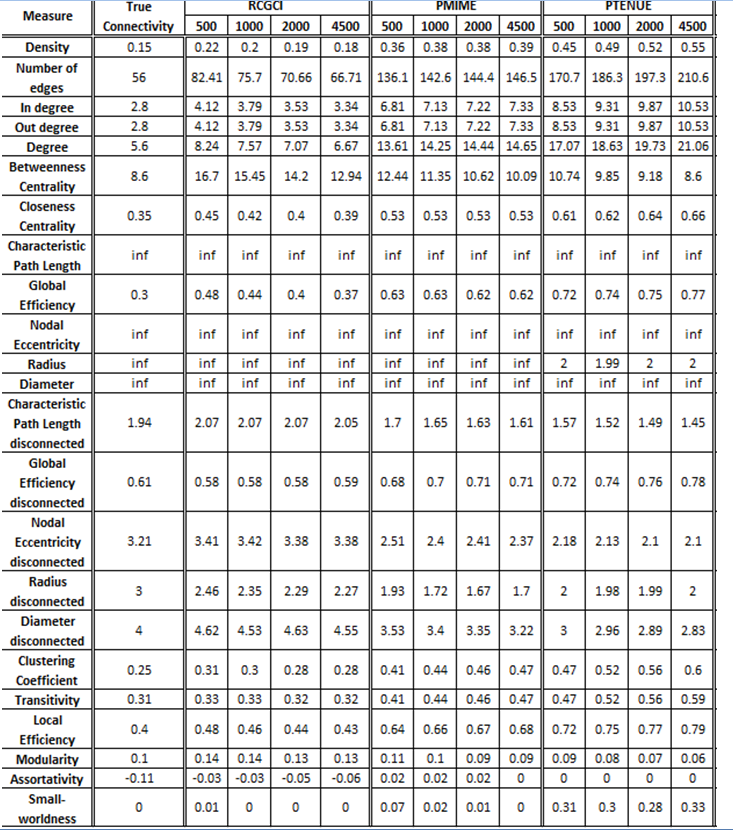
All three causality measures fail to replicate the basic characteristics of the real network (e.g. number of nodes and edges, density), especially PMIME and PTENUE. PTENUE, however, gest very good results for average betweenness centrality, while RCGCI gets better values for closeness centrality. RCGCI also outstands in performance for segregation measures and average local efficiency, especially for timeseries of length 4500.
iii. Coupled Henon maps, 20 variables
The exported results of network measures based on the true connectivity network and the extracted connectivity networks based on the causality measures RCGCI, PMIME and PTENUE for time series length of 500, 1000, 2000 and 4500.
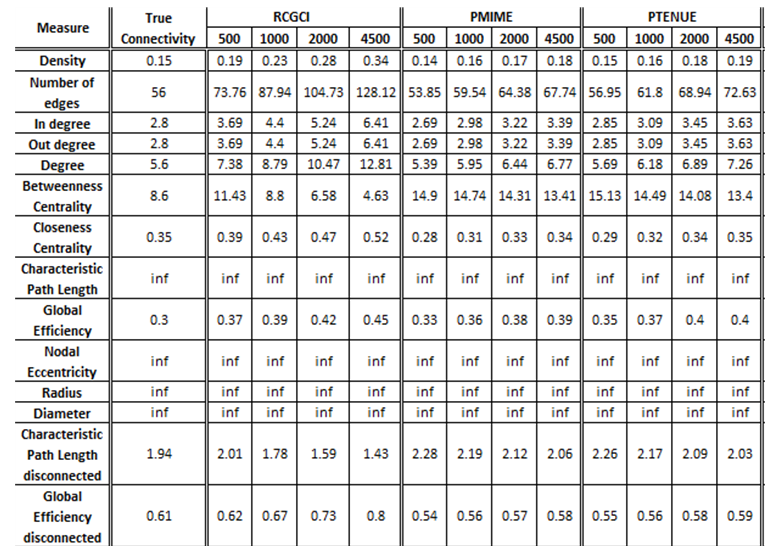
There is no causality measure that outstands in performance, but PMIME is the one that differs on average the least by true connectivity.
- VAR(1) in 20 variables
The exported results of network measures based on the true connectivity network and the extracted connectivity networks based on the causality measures RCGCI, PMIME and PTENUE for time series length of 500, 1000, 2000 and 4500.

All three causality measures fail to replicate the basic characteristics of the real network (e.g. number of nodes and edges), especially PMIME and PTENUE. These two also fail to replicate the centrality measures, while RCGCI gives significantly better results. On the other hand, all three measures give quite good results for integration and segregation measures, in which PTENUE for timeseries of length 4500 outstands in performance. Altogether, RCGCI gives the best results, that differ less by true connectivity, especially for longer timeseries.
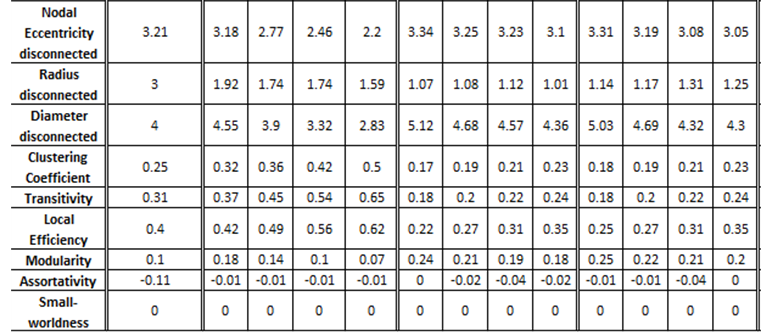
- VAR(5) in 20 variables
The exported results of network measures based on the true connectivity network and the extracted connectivity networks based on the causality measures RCGCI, PMIME and PTENUE for time series length of 500, 1000, 2000 and 4500.

All three causality measures fail to replicate the basic characteristics of the real network (e.g. number of nodes and edges), especially PMIME and PTENUE. These two also fail to replicate the centrality measures, while RCGCI gives significantly better results for closeness centrality. On the other hand, all three measures give quite good results for integration and segregation measures, in which RCGCI for timeseries of length 4500 outstands in performance. Altogether, RCGCI gives the best results, however, they show quite significant discrepancies from true connectivity.
iii. Coupled Henon maps, 20 variables
The exported results of network measures based on the true connectivity network and the extracted connectivity networks based on the causality measures RCGCI, PMIME and PTENUE for time series length of 500, 1000, 2000 and 4500.
Networks created using PMIME and PTENUE are the ones that are closer to true connectivity networks, mainly for short timeseries. However, there are measures such as average betweenness centrality and modularity where RCGCI values are better, compared to PMIME and PTENUE.